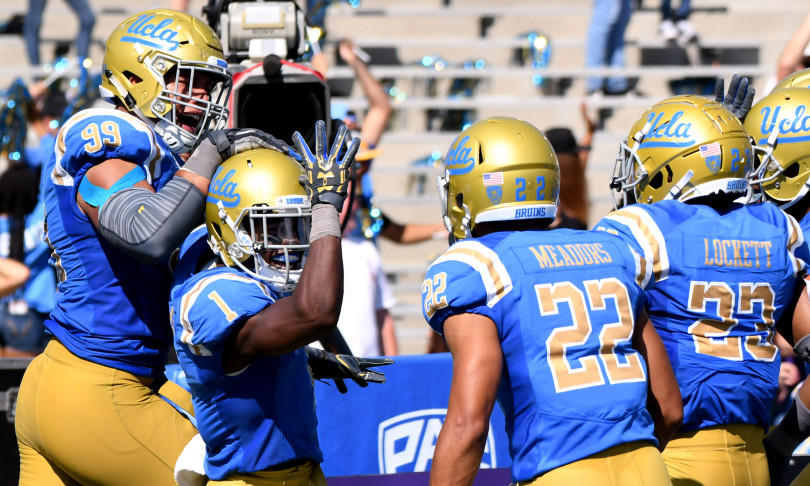
Pregame graph: How can UCLA upset Washington?

Washington quarterback Jake Browning is sacked by USC’s Rasheem Green last year during USC’s 26-13 win over UW at Husky Stadium. (Elaine Thompson / Associated Press)

Entering Saturday’s game against UCLA, Washington is coming off its first loss this season. It’s a rare feeling for the No. 12 Huskies, who have lost only three games since the beginning of the 2016.

UW lost to USC at home, Alabama in the College Football Playoff and Arizona State in Tempe last weekend. What does UCLA have to do Saturday to join that short list?

Let’s examine all of UW’s games during the past two seasons: Continue reading “Pregame graph: How can UCLA upset Washington?” »

Pregame graph: Midseason check point

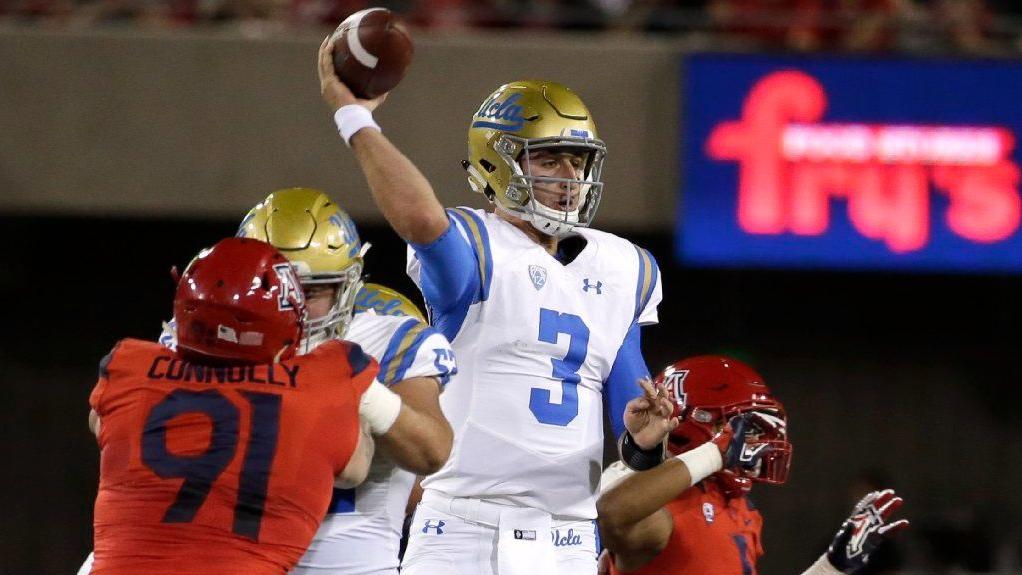
Despite throwing for 392.3 yards per game in the the first half of the season, quarterback Josh Rosen has also thrown eight interceptions. (Rick Scuteri / Associated Press)

Halfway through the 2017 season, UCLA is sitting at the exact same place it was this time last year: 3-3 overall and 1-2 Pac-12 after a loss in the desert. This was when things fell apart for the Bruins last year as quarterback Josh Rosen suffered a season-ending shoulder injury in the sixth game of the year.

With Rosen healthy, the Bruins are trying to keep things together in the second half this year. They need three wins out of their final six to secure bowl eligibility, but don’t have much margin for error with road games against Washington, Utah and USC waiting. UCLA’s best chance to make a bowl game would be run the table at home, starting with Saturday’s game against Oregon at 1 p.m.

The Rose Bowl has treated the Bruins well so far this year as they’re 3-0 at home. Here’s how UCLA has performed in each game during the first half of the year: Continue reading “Pregame graph: Midseason check point” »

Pregame graph: Who are UCLA’s go-to third-down options?

UCLA wide receiver Jordan Lasley (2) runs on a touchdown reception past Stanford cornerback Malik Antoine (3) during the second half of an NCAA college football game Saturday, Sept. 23, 2017, in Stanford, Calif. (AP Photo/Marcio Jose Sanchez)

Soso Jamabo called his 7-yard run on third-and-6 with 2:37 left against Colorado “the biggest play of the season.” It allowed UCLA to extend a critical drive in a tight game and whittle down the clock en route to an important conference win.

One of the biggest improvements in UCLA’s offense this year is its third-down conversion rate. Last year, the Bruins ranked last in the conference at 35.2 percent. After five games under offensive coordinator Jedd Fisch, UCLA is tied with Arizona for third in the Pac-12 at 47.1 percent (33 of 70). Only Washington and Washington State are better.

Here’s a look at UCLA’s third-down performance this season, broken down by player and play type (rushing or passing):  Continue reading “Pregame graph: Who are UCLA’s go-to third-down options?” »

Pregame graph: The turnover battle

UCLA defensive back Darnay Holmes (1) reacts after intercepting a Hawaii pass for touchdown in the first half of a NCAA college football game at the Rose Bowl in Pasadena, Calif., Saturday, Sept. 9, 2017. Holmes has scored UCLA’s only touchdown off a turnover this year. (Photo by Keith Birmingham, Pasadena Star-News/SCNG)

UCLA does not have much to complain about on offense, but turnovers are holding the Bruins back from truly enjoying their sizzling offense.

UCLA is 11th in the Pac-12 in turnover margin at minus-5, ahead of only Oregon State’s minus-6. Opponents have scored 40 points off 10 UCLA turnovers this season while the Bruins have only 10 points to show for five takeaways. UCLA’s five takeaways on defense are the second-fewest in the Pac-12. Only Arizona State has forced fewer turnovers (four).

Here’s a look at drives that started with a turnover from both the Bruins and their opponents. The arrows pointing toward the left are opponent drives, while the arrows pointing toward the right are drives by the UCLA offense. Arrow lengths indicate where the drive started and where it ended. The final play of the drive is included when applicable.  Continue reading “Pregame graph: The turnover battle” »

Pregame graph: The game(s) within the game

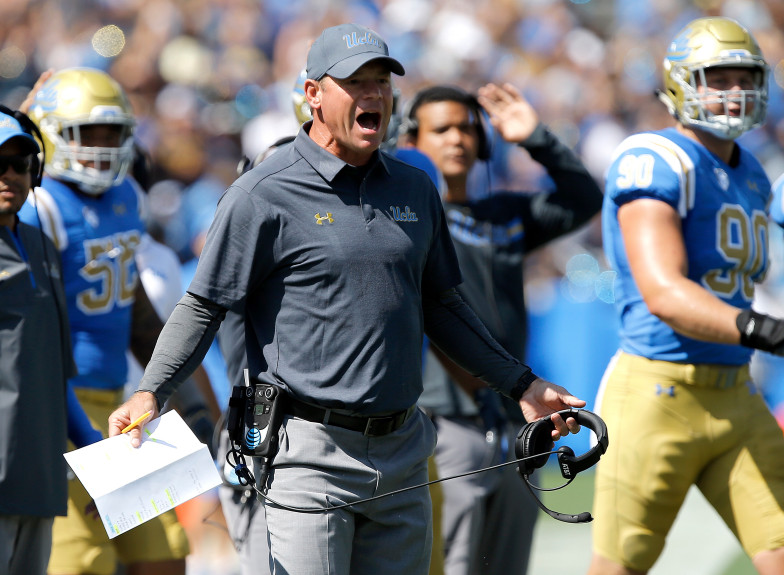
UCLA head coach Jim Mora, center, yells at a referee during the first half of an NCAA college football game against Hawaii in Pasadena, Calif., Saturday, Sept. 9, 2017. (AP Photo/Alex Gallardo)

Of the many statistical battles that contribute to the outcome of a football game, UCLA has identified four main ones that contribute to wins: turnovers, explosive plays, sacks and red-zone trips.

Head coach Jim Mora said Wednesday the UCLA staff has studied years of games in the Pac-12 and found that the teams with fewer turnovers and more explosive gains win more than 90 percent of the time. Mora added that sacks and red-zone trips are the third and fourth most-significant contributing factors, respectively, according to the program’s research.

So as the Bruins try yet again to snap their losing streak to Stanford, here’s a look at UCLA’s performance against the Cardinal during Mora’s tenure with regard to his four key statistical categories: Continue reading “Pregame graph: The game(s) within the game” »